zaterdag 18 november 2023

Best Practices in Defining a Data Warehouse Architecture

This blogpost is part of a series of which the following posts have been published:

The opening statement

What is a data mesh?

Coherent business concepts keep the data relevant

In any data mesh architecture, the data warehouse is and will be a critical component for many reasons. First and foremost: some analytics need industrialised solutions, automating the entire flow from raw data tot finished reports. Structured data will always contribute to the analytical environment and will need a relational model to provide the foundation for analyses. In my experience, the most flexible and sustainable model is the process based star schema architecture from Ralph Kimball. In  one of my previous posts I have made the case for this approach.

 And in the context of a data lake project I positioned the Kimball approach as the best in class

The process diagram below tells the story of requirements gathering, ingesting all sorts of data in the lake and making the distinction between structured and unstructured data. Identifying the common dimensions and facts is crucial to make the concept work. Either you provide an increment to an existing data mart bus or you introduce a new process metrics fact table with foreign keys from existing and new dimensions.


Best practices in DWH
Managing structured and unstructured data in a data mesh environment

Making the case for the data warehouse as an endpoint of unstructured analysis

A lot of advanced analytics can be facilitated by the data lake. Think of text analytics, social media analytics and image processing. The outcomes of these analyses may find their way to the data warehouse. For example: polarity analysis in social media. Imagine a bank or a telecom provider capturing the social media comments on its performance. As we all know from customer feedback analysis, only the emotions two or three sigma away from the mean make it to social media. The client is either very satisfied or very dissatisfied and wants the world to know. Taking snapshots of the client’s mood and relating it to his financial or communication behaviour may yield interesting information. Already today, some banks are capturing their client’s mood to determine the optimum conditions to present their services. Aggregating these data may even provide macro-economic data correlating with the business cycle.

Have a look at the diagram below and imagine the business questions it can answer for you.

A high level star schema integrating social messages and their polarity with sales metrics

Think of time series: is there a some form of a leading indicator of sales in the polarity of this customer’s social messages?

If one of our products is the subject of a social media post, has this any (positive or negative) effect on sales of that particular product?

What social media sources have the greatest impact on our brand equity?

I am sure you will add your dimensions and business questions to the model. And by doing so you are realising one of the main traits of a data mesh: delivering data as a product.

I hope I have made my point clear: even in the most sophisticated data lakehouse supporting a data mesh architecture, the data warehouse is not going away.

In the next blog article we will focus on governing the data ingestion process.

Stay tuned!

zaterdag 11 november 2023

Start with Defining Coherent Business Concepts

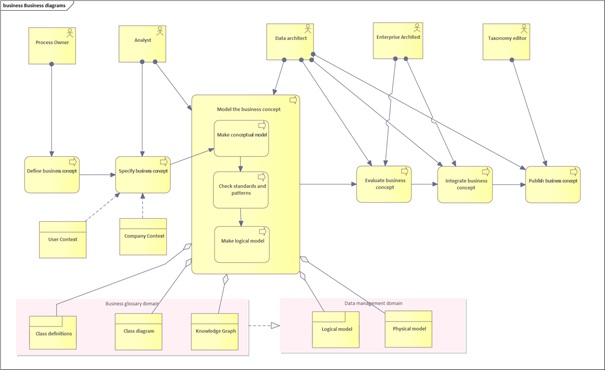
Below is a diagram describing the governance process of defining and implementing business concepts in a data mesh environment. The business glossary domain is the user facing side of a data catalogue whereas the data management domain is the backend topology of the data catalogue. It describes how business concepts are implemented in databases, whether in virtual or persistent storage.

But first and foremost: it is the glue that holds any dispersed data landscape together. If you can govern the meaning of any data model, any implementation of concepts like PARTY, PARTY ROLE, PROJECT, ASSET and PRODUCT to name a few, the data can be anywhere, in any form but the usability will be guaranteed. Of course, data quality will be a local responsibility in case global concepts need specialisation to cater for local information needs.


Business perspective on defining and implementing a business concept for a data mesh

FAQ on this process model

Why does the process owner initiate the process?

The reason is simple: process owners have a transversal view on the enterprise and are aware they organisation needs shareable concepts.

Do we still need class definitions and class diagrams in data lakehouses?

Yes, since a great deal of data is still in a structured ”schema on write” form and even unstructured or “schema on read” data may benefit from a class diagram creating order in and  comprehension from the underlying data. Even streaming analytics use some tabular form to make the data exploitable.

What is the role of the taxonomy editor?

He or she will make sure the published concept is in synch with the overall knowledge categorisation, providing “the right path” to the concept.

Is there always need for a physical data model?

Sure, any conceptual data model can be physically implemented via a relational model, a NoSQL model in any of the flavours or a native graph database. So yes, if you want complete governance from business concept to implementation, the physical model is also in scope. 

Any questions you might have?

Drop me line or reply in the comments.

The next blog article Best Practices in Defining a Data Warehouse Architecture will focus on the place of a data warehouse in a data mesh.


dinsdag 31 oktober 2023

Defining a Data Mesh

Zhamak Dehgani cornered the concept of a data mesh in 2019. The data mesh is characterised by four important aspects:

  • Data is organised by business domain;
  • Data is packaged as a product, ready for consumption;
  • Governance is federated
  • A data mesh enables self-service data platforms.

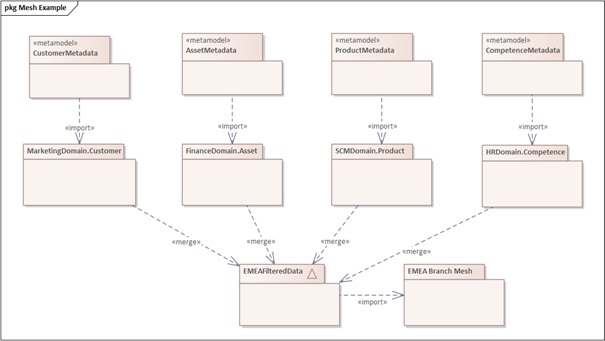
Below is an example of a data mesh architecture. The HQ of a multinational food marketer is responsible for the global governance of customers (i.e. retailers and buying organisations), assets (but limited to the global manufacturing sites), products (i.e. the composition of global brands) and competences that are supposed to be present in all subsidiaries. 

The metamodels are governed at the HQ and data for the EMEA Branch are packaged with all the necessary metadata needed for EMEA Branch consumption. These data products are imported in the EMEA Data Mesh where they will be merged with EMEA level data on products (i.e. localised and local brands), local competences, local customer knowledge and local assets like vehicles, offices…


Example of a data mesh architecture, repackaging data from the HQ Domains into an EMEA branch package

The data producer’s domain knowledge and place in the organisation enables the domain experts to set data governance policies focused on business definitions, documentation, data quality, and data access, i.e. information security and privacy. This “data packaging” enables self-service use across an organisation.

This federated approach allows for more flexibility compared to central, monolithic systems. But this does not mean traditional storage systems, like data lakes or data warehouses cannot be used in a mesh. It just means that their use has shifted from a single, centralized data platform to multiple decentralized data repositories, connected via a conceptual layer and preferably governed via a powerful data catalogue.

The data mesh concept is easy to compare to microservices helping business audiences understand its use. As this distributed architecture is particularly helpful in scaling data needs across complex organizations like multinationals, government agencies and conglomerates, it is by no means a useful solution for SME or even larger companies that sell a limited range of products to a limited type of customers.

In the next blog Start with defining coherent business concepts we will illustrate a data governance process, typical for a data mesh architecture. 

dinsdag 24 oktober 2023

Why Data Governance is here to stay

More than a fairly stable Google Trend Index, proving that Data Governance issues won’t go away is the fact that “Johnny-come-lately-but-always-catches-up-in-the-end” Microsoft is seriously investing in its data governance software. After letting the playing field for innovators like Ataccama, Alation,  Alex Solutions and Collibra, Microsoft is ramping the functionality of its data catalogue product, Purview.


Google Trend Index "Data Governance"
Google Trend Index on "Data Governance"

The reason for this is twofold: the emerging multicloud architectures as well as the advent of the data mesh architecture driving new data ecosystems for complex data landscapes.

Without firm data governance processes and software supporting these processes, the return on information would produce negative figures.

In the next blog Defining a Data Mesh  I will define what a data mesh is about and in the following blog articles I will suggest a few measures needed to avoid data swamps. Stay tuned!

dinsdag 21 februari 2023

How will ChatGPT affect the practice of business analysis and enterprise architecture?


ChatGPT (Chat Generative Pre-trained Transformer), is a language model-based chat bot developed by OpenAI enabling users to refine and steer a conversation towards a desired length, format, style, level of detail, and language.  Many of my colleagues are assessing the impact of Artificial Intelligence products on their practice and the jury is still out there: some of them consider it a threat that will wipe out their business model and others see it as an opportunity to improve productivity and effectiveness of their practice.


I have a somewhat different opinion. Language training models use gigantic amounts of data to train the models but I am afraid if you want to use the Internet data you certainly have a massive amount of data but of dubious and not always verifiable quality.

General Internet data is polluted with commercial content, hoaxes and ambiguous statements that need strong cultural background analysis to make sense of it.

The data that has better quality than general Internet data is almost always protected by a copyright; Therefore use without permission is not always gentlemanlike to say the least.

Another source of training data are the whitepapers and other information packages you get in exchange for your data: e-mail, function, company,… These documents often start with stating a problem in a correct and useful way but then direct you to the solution delivered by their product.

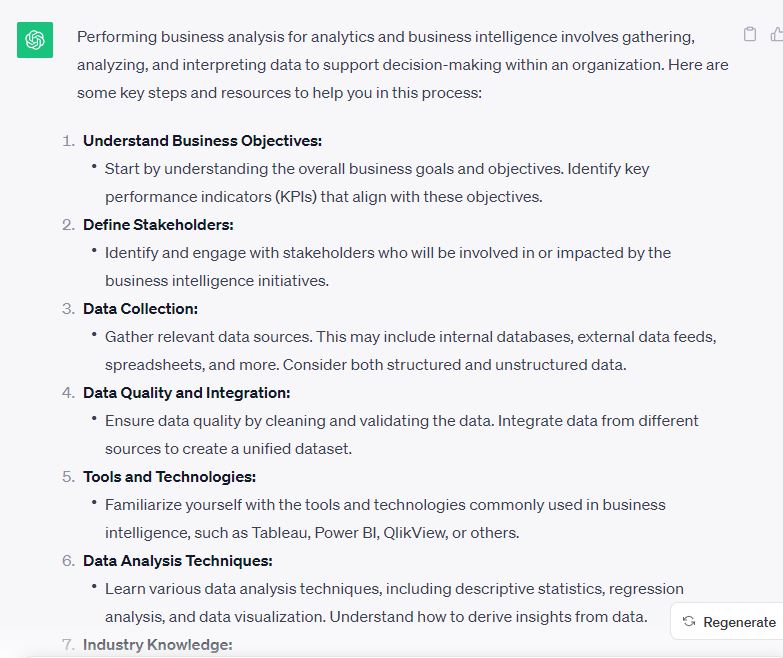
The best practices in business analysis and enterprise architecture are -I am afraid- not on the Internet. They’re like news articles behind a paywall. So if you ask CHAT GPT a question like “Where can I find information to do business analysis for analytics and business intelligence?” You get superficial answers that –at best- provide a starting point to study the topic.


A screenshot of the shallow and casual reply. It goes on with riveting advice like “Stay Informed”, “Training and Certification”, “Networking”, “Documentation”,…

And the question “What are Best Practices in business intelligence” leads to the same level of platitudes and triteness:

  • “Align with business goals” who would have thought that?
  • “User involvement and collaboration” Really?
  • “Data Quality and Governance” Sure, but how? And when and where?

In conclusion: a professional analyst or enterprise architect has nothing to fear from ChatGPT. 


At best, it provides a somewhat more verbose and redacted answer to a question saving you the time to plough through over a billion answers from Google.


maandag 5 december 2022

Data Architecture as a Consequence of Organisation Design


Lingua Franca was involved in the data architecture of an organisation which name and type is of no interest for the case I am making. Namely,  the way an organisation functions and is structured determines the data architecture. It is a text book example of many organisations today.

The organisation was a merger of various business units which all used their own proprietary business processes, data standards and data definitions.

The CIO had a vision of well governed, standardised processes that would create a unified organisation that operated in a predictable and transparent manner.

Harmonised End to End Processes Are the Basis of Transparent Decision Making

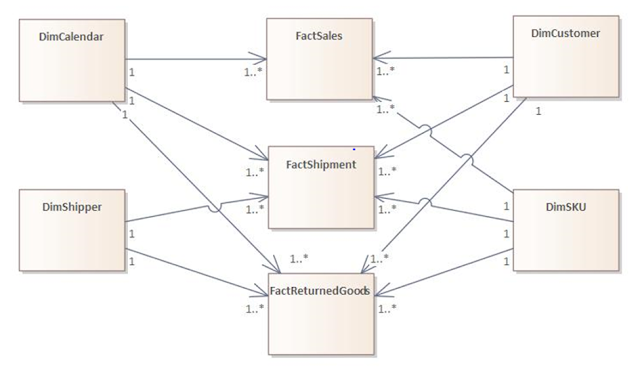
Common dimensions and common facts

Shared facts and dimensions assure a scalable and manageable analytics architecture

The case for a Kimball approach in data warehousing was clear: if every department, every knowledge unit would use the same processes, the shared facts and common dimension architecture was a no brainer.

As the diagram suggests: it takes effort to make sure everybody is on the same page about the metrics and the dimensions but once this is established, new iterations will go smoothly and build trust in the data.

For more than 4 years, the resistance to change wore the CIO, data warehouse team and finally the data architect out when the CIO left the organisation. The new CIO decided to not continue the fight for harmonised processes and saw this as a reduced need for a data warehouse. If every business unit would use its own operational reporting, it would produce rapid results at a far lower cost than a data warehouse foundation delivering the reports. A new crew was on boarded: two ETL developers, two front end developers and a data architect.

Satisfying Clients in Their Operational Silos Creates Technical Debt

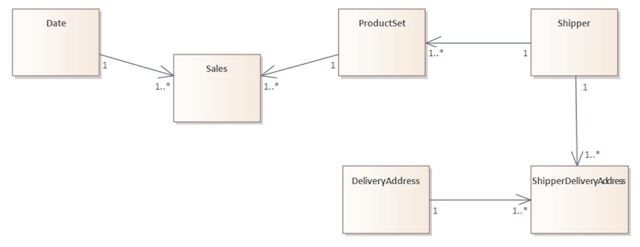
A third normal form data model for operational reporting

Cutting corners for fast delivery creates technical debt, that needs to be repaid

As this diagram suggests, the client defines his particular needs, asking for a report not on SKU level because he’s only interested in product sets. The sets require special handling so they are linked to specific shippers who have their delivery areas.  Although this schema may cause no problems for the frontend developer to produce a nice looking report, consolidating the information on corporate level will take time and effort.

The reality will prove differently, of course. If every business unit uses its own definitions, metrics and dimensions there is no chance of having correct, aggregated information for strategic decision making. To remedy this shortcoming, the new data architect will have to go back to 2008, publish date of Bill Inmon’s  DW 2.0. The idea is to create the operational report as fast as possible and after delivering the product refactor the underlying data to make them compatible with other data used in previous reports.

The result is a serious governance effort, lots of rework and an ever growing DW 2.0 in the third normal form that one day may contain sufficient enterprise wide data to produce meaningful aggregates for strategic direction. The Corporate Information factory (CIF) revisited so to speak.

Why the CIF Never Realised Any Value

In Inmon’s world, it was recommended to build the entire data warehouse before extracting any data marts. These data marts are aggregates, based on user profiles or functions in the organisation and are groupings of detailed data that may change over time.

This led to many problems on the sites I have visited during my career as a business analyst and data architect.

First and foremost: by the time you have covered the entire scope of the CIF, the world has changed and you can refactor entire parts of the  data model and reload quite a few data to be in synch with new realities. Doing this on a 3NF data schema can be quite complex and time and resource consuming. And then there is the data mart management problem: if requirements for aggregations change over time, keeping track of historical changes in aggregations and trends is a real pain.


About DW 2.0: the Data Quagmire


To anyone who hasn’t read this book: it’s the last attempt of the “father of data warehousing” to defend his erroneous Corporate Information Factory (CIF), adding some text data to a structured data warehouse in the third normal form. The book is full of conceptual drawings but that is all they are; not one implementation direction follows up on the drawings. Compare this to the Kimball books where every architectural concept is translated into SQL scripts and clear instructions and you know where the real value is.

With DW 2.0 the organisation is trying to salvage some of the operational reports’ value but at a cost, significantly higher than respecting the principle “Do IT right the first time”. The only good thing about this new approach is that nobody will notice the cost overrun because it is spread over numerous operational reports over time. Only when the functional data marts need rebuilding, may some people notice the data quagmire the organisation has stepped into.

Conclusion, to paraphrase A.D. Chandler: Data structure follows strategy


maandag 28 juni 2021

Managing a Data Lake Project Part III: Architecture Drives the Project Method

Remember the old days when the data warehouse was the only source of the facts and answered almost any business question, provided the data were available in the source systems? Today, more and more data is beyond our control. “Control” in the sense of precooked structures, well documented and well governed data objects. More and more data is generated from sources beyond our control. And only the data lake can facilitate comprehensive analytics.

To make clear how the architecture of a data lake drives the project approach, it is necessary we review the three major data warehouse architectures and their project approach before we present the new methods needed in a data lake environment.

 The Kimball architecture and its project approach


Ralph Kimball’s star schema approach is the most used -and as far as I am concerned- the most pragmatic low-threshold approach to data warehousing. Each dimension is constructed with an enterprise view and shared in the appropriate data marts. And each data mart represents a business process. For project managers, this means that an enterprise scan is needed to define the dimensions, followed by a study on the combination “information value times feasibility” to pick the order of execution. 

The Lindstedt architecture and its project approach


The great advantage of a data vault is its flexibility to adapt to new situations, new data sources and other changes in the data landscape. Like the Kimball method, it focuses on business processes and models these in a highly normalised way using hashes to “freeze” temporal links between objects and their attributes.  What this means to the project approach is obvious: we postpone the materialisation of a queryable schema until we are sure about the data persistence. In many of the projects we managed, a seamless transition from a data vault to star schema was made. For project managers, this means a heavy focus on the business process and a flexible way of representing all the processes and delivering queryable data whenever the need for it was expressed by the business.


The Corporate Information Factory architecture from Inmon and its project approach


The Inmon approach is something completely different from the previous methods. As of the early 1990s Inmon has made his case for a corporate information factory (CIF) that would take every data source in scope, build a target model in the third Normal Form (3NF) and once this Herculean task was competed it was finally time to deliver. In his method functional data marts would provide extracts from the CIF. Think of an HR data mart, a marketing data mart, a finance data mart, etc… No need to say this can only work in very stable environments where the external factors don’t influence too much the approach to analytics. In all the projects me and my colleagues have been involved this was the Never-ending Project. Please don’t go there. And if, by any chance there is a business case for this approach, allow for sufficient time and resources. You will need it. 


The data lake architecture and its project approach

A data lake project is a completely different story form the previous three: no more up front analysis of concepts, objects, entities and attributes that contribute to these concepts before building the data stores.

In a nutshell, a data lake project is about looking for cheap and simple storage like S3 on Amazon Web Services or ALS on Azure, making sure the ingestion data pipelines are in place to receive all sorts of data and once these data are in place, making sure they are ready for exploitation.  For project managers, this means a totally different project management flow. Contrary to the three previous architectures, there is no synching between business and tech: after a high level business analysis, the technical track will provide for data storage, data access and data cataloguing to make it exploitable for the business.