donderdag 19 april 2018

How to make progress in a political organisation

Why Business Analysis and politics don’t mix.


After thirty years of practice in all sorts and flavours of organisations there’s one that stands out as a tough conundrum for any business analyst and by extension enterprise architect as well as project managers. It’s the political organisation, so eloquently described by Henry Mintzberg. 
The problem with these organisations for a business analyst, project manager or enterprise architect is identical: setting priorities to determine the first iteration of the development cycle. This lack of priority ranking may lead to scope creep, projects that never deliver the product or a user community that is not on board, etc…


Forces in a political organisation

Wouldn't we all like to work in Tom Davenports Analytical Organisation?

In the paragraph “Decisions, Teams, and Groups at Work, Classification of Decision-Making Environments, I use a simple matrix to describe decision-making contexts for BI projects. But, believe me, you can use it for any project type.

You don’t need much time to determine if you’re in a political organisation. Look for committees that make the ultimate decisions, look for a lack of accountable individuals, slow decision making processes and a track record of projects that failed to deliver the intended product. Of course government bodies are by definition political but you will also find them in the private sector.

How to recognise a political organisation before you’re even at the reception desk?

Maybe this table can help:


Political organisations, by definition, don’t have shared goals. Each alderman, state secretary, each manager, wants to score his goals without letting the team take any credit for it. Because re-election or promotion matter… And political organisations always differ on the cause and effect chains which shows clearly in analytical projects.

Setting priorities in a political organisation


You can imagine that this is the toughest conundrum to solve; if you can’t prioritise “because everything is important” you can’t even start an analysis track. Unless you simply want to sell billable hours… And prepare for a debriefing and passing the buck, dodging any responsibility.
But if you’re a hired gun that may be exactly why you’ve been hired: to take the blame for the organisation’s ineptness to take responsibility and make choices even if they go against some members of the team. (I use “team” for want of a better word in a political organisation)
In this post, I am giving you a few tips and tricks to force the “team” to come up with priorities.

But first some context. The organisation is looking for a new way to analyse structured and unstructured data; Therefore it needs a modern data architecture. Your job as business analyst (and by extension project manager and enterprise architect) is to know what the strategic priorities of the organisation are.  This needs to match with the available data and information needs. You need to check the feasibility and then choose the first iteration to deliver analytical results.  A best practice is to check the organisation’s strategy, its initiatives to improve the organisation’s position in case of a commercial entity or the level of societal utility in case of a governmental or non for profit organisation.
Imagine the first intake with the project sponsor, the product owner and any other stakeholder who has been identified in the project structure.

Here’s the dialogue:

Business Analyst: At the kick off of this analysis track, I’d like to determine with you the first iteration: where we start analysing, designing and building the first deliverables.
The “team”: (silence)
Business Analyst: Do you have a project portfolio and do you use program management to prioritise the management actions? Do you have mission and vision statement for this project?
The “team”: We thought you could formulate the vision and the mission for the project. And no we don’t have a project portfolio. We do have an Excel sheet with a list of all the projects and their status.
Business Analyst: Could we infer from the status what the priorities are?
The “team”: No.
Business Analyst: What if we look at the budget per management project. Maybe the size says something about the priority? Or what if look at rejected project proposals and the reasons? Maybe that says something about the criteria.
The “team”: Not necessarily. First of all, all management project requests are answered positively and funds are allocated to these projects. Some projects may have big budgets but that doesn’t indicate anything about their importance.
Business Analyst: What about the number of full time equivalents allocated to each project?
The “team”: A high number may indicate something about the complexity or the scope but that doesn’t tell you what priority the project has.
Business Analyst: I think this one may help us out: have you indicated the origins of leakages and losses in your business processes and could those numbers give us a hint of what’s important to the management team?
The “team”: Leaks and losses are handled by the management team and as such are equally important.
Business Analyst: Does the amount of data, the connection with business processes and the variety in the data give us a clue where we should start the project?
The “team”: That’s we are hiring you as a Business Analyst.

Now it gets tricky and you make the call, as The Clash sing: “Should I stay or should I go”

Here are few of the killer questions and remarks that will lead you to the exit:

  • What projects will get or got the most press coverage?
  • What if you had to choose, right now?
  • Do you expect me to deliver a successful end result if you don’t know what you want?


More on decision making contexts in the book “Business Analysis for Business Intelligence” p. 203 – 213 


Is there way out? Maybe.


The only escape route I can think of is to start with a stakeholder analysis. Try defining the primary stakeholders and map them on a RACI matrix. If that works, you can develop your first iteration with some confidence, knowing that danger is always on the road ahead..

Example of a stakeholder analysis that turns out well: the CEO’s desk is where the buck stops.

If a stakeholder analysis is inconclusive, there must be someone who’s not involved in the official decision making unit (DMU) who is the primary influencer. Now you’ll have to get out of your comfort zone as an analyst and start thinking like an account manager.

I was lucky to have training in the Miller Heiman Strategic Selling method as well as the Holden Power Base Selling method. It sharpened my skills for identifying and influencing these hidden decision makers. So here’s my advice: check out these two books. They will increase your efficiency in political organisations with an order of magnitude.
Target account selling; Fox hunting

The new strategic selling is an update of the original, worth reading for any novice in business analysis and project management.
This is Jim Holden’s original book. Of course, as things go in this business, there were many to follow up on his success. Start here anyway.

zondag 24 december 2017

Getting practical: How Analytics Can Drive the Information Architecture Development


Does the theory presented in the previous article work in practice? That is the theme of this post where I present an (anonymous) case from a project I did for a customer.
But before I proceed, a quick reminder from my book “Business Analysis for Business Intelligence”.
What every organisation needs to know boils down to four C’s. It is information about the customer, the cost, the competition and the competences of the organisation, the latter also represented by a higher level of abstraction: the capabilities.
The illustration below shows how these four C’s are the foundation of a balanced scorecard. But a balanced scorecard measures only the intended –or planned- strategy, not the emergent strategies. Therefore, this 4 C framework has a much broader scope and includes decision support for emergent strategies. 


To develop a shared knowledge of the customer, this organisation needed to embed a business rule in the data namely that contacts are associated with an account. This, because the organisation is an exclusive business-to-business marketing machine selling to large corporations. A contact without this association was registered and kept in a staging area, waiting to be associated with an account. In other words: only contacts related to an organisation were of use to the business. At least, in the present context. 


Today, this rule is cast in stone in a monolithic CRM application but the CIO wishes to migrate to a service factory in the near future. This way, when the business rule would change or when the company would move to a B2C market, the CRM processes would be easier to adapt to the new situation. A transition plan for all customer data needs to be developed.
Lingua Franca used the following phased approach:
  1. ·        Mapping the customer data in a data portfolio
  2. ·        Study the ASIS
  3. ·        Link capabilities to analytics
  4. ·        Map the capabilities on the data portfolio
  5. ·        Define the information landscape
  6. ·        Make the mapping analytics – transactional data
  7. ·        Define the services
  8. ·        Decide on the physical architecture


Mapping the customer data in a data portfolio 

A lot of customer data is of strategic value and a lot isn’t. That led us to use a modified version of McFarlan’s portfolio approach to information systems which can just as well be applied to data.
Variant on: McFarlan, F. W. (1981). "Portfolio approach to information systems.
"Harvard Business Review (September–October 1981): 142-150

The analytics version of this schema translates the four quadrants into workable definitions:
Strategic Data: critical to future strategy development: both forming and executing strategy are supported by the data, as well as emergent strategies where data might be captured outside the exiting process support systems.  The reason is clear: process support or transaction support systems are designed and tuned for the intended strategy. 
Turnaround Data: critical to future business success as today’s operations are not supported, new operations will be needed to execute. These data are often not even in scope of the emergent strategy processes. They may be hidden in a competitor’s research, in technological breakthroughs, in new government regulations or in consumer outcries against abuse to name a few sources.
Support Data: Valuable but not critical to success
Factory Data: critical to existing business operations: the classical reports, dashboards and scorecards
In this case, the association between account and contact was considered factory data as it describes the way the company is doing business today

As the illustration below in the Archimate model shows, there is a cascading flow of business drivers and stakeholders that influence the business goals which in their turn impact the requirements that are realised by business processes. These are supported by legacy systems and new software packages or bespoke applications. The result of this approach is a dispersed view on the data that are used and produced in these applications. What if not processes but data would be at the base of the requirements? Would this change the organisation’s agility? Would it enhance responsiveness to external influence? That was the exercise we were preparing for. 


Generic enterprise architecture
Data dispersion in a classical IT landscape


.


Study the ASIS

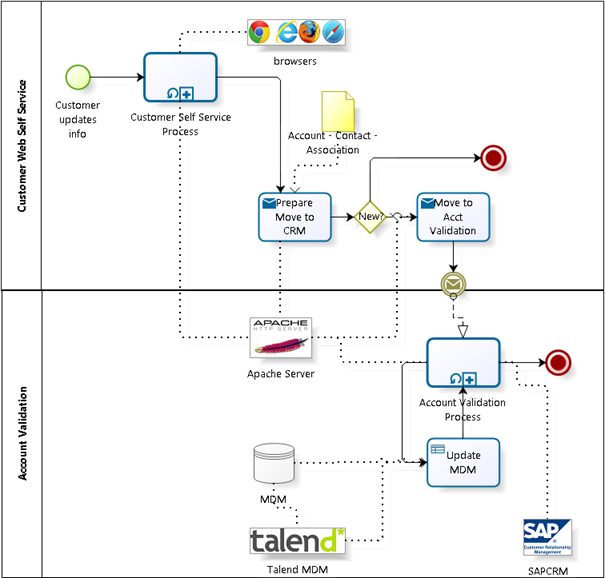
Today, the business process of account and contact registrations is as follows:


The present CRM monolith supports this process but future developments like the takeover of a more consumer oriented business may change the business model and the business process drastically. Thus, the self-service registration process should make the link between contact and account optional and the validation process should only deal with harmonising data to make sure the geographical information is correct and contact data are uniform as far as (internal) naming conventions and (external) reference data are concerned. It is already a great step forward that the company uses a master data management system to separate data management from process management. This enables a smoother transition to the new information architecture development method. 

Link capabilities to analytics

Therefore an extensive inventory of all potentially needed business capabilities is undertaken and linked to the relevant business questions supporting these capabilities.
In this example we present a few of these present and future business questions:
What is the proportion of contacts from our B2B customers that may be interested in our consumer business?
Which accounts may experience a potential threat from our new consumer business unit?
Which contacts from the B2C may become interested in our B2B offerings?
Which products from the B2C unit may prove sellable via the B2B channels?
By listing all the relevant present and future business questions, it becomes clear that the account validation process as it is defined today may need to change and what is considered factory data today may get an “upgrade” to strategic and turnaround data to deal with the challenges.


Map the capabilities on the data portfolio


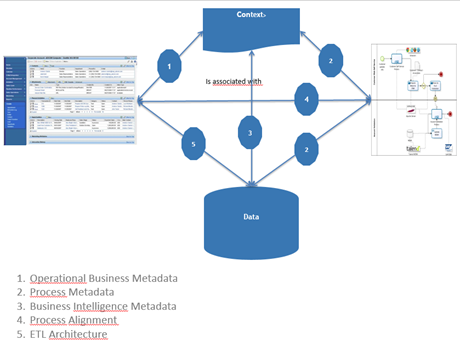
In this diagram, the entire data landscape of the account – contact association is charted and managed via five methods. 
Operational business metadata describe the context in which data is created, updated and deleted as well as the context in which it is used. A minimum deliverable is instructions and training for the people who perform the CRUD operations.Process metadata relates the business process (present and future) to the business context to provide the process stakeholders with information and motivation: the what, why, when and who of the process and the data captured.Business Intelligence metadata describes the decision support possibilities in the present and future clients: dashboards, reports, cubes, data sets for further examination,…Process alignment: it describes what is often a mutual adjustment between a monolithic application and the business process it supports. Some market leaders in OLTP software present their process flows as best practice. As if all businesses should converge in their way of doing business…ETL Architecture documents the lineage from source to target, the transformations, quality measures, as well as the technical aspects of the process i.e. parallel or sequential loading, dropping of indexes and rebuilding them, hashing, etc… 

Define the information landscape

Even in this simple customer – account relationship some thinking needs to be done about a holistic view on the essential elements defining the relationship. By “essential” I mean the minimum attributes and levels of detail that need to be shared outside the context of CRM to be used in other business functions like HR, operations, finance,…
Here are a few of the considerations to be made:
How long is a customer considered as such? If the average buying frequency of your product is twice a year, for how many years do you keep the relationship active if for three years no order has come in? How do we compare the account performance in case of mergers? Does an account always need a DUNS number? Or a VAT registration? What about informal groups regularly doing group purchases? Discussing these and many other issues lays the foundation for a data governance process. 


Make the mapping analytics – transactional data

This phase is crucial for the quality of your decision support system and is very much like the business analysis process for analytics. Start with high level concepts and descend to the lowest grain of attributes and transaction records as well as external sources like social media, open data and market research data.For instance: “customer loyalty” is expressed as “a constantly high share of wallet over an average historic period of time of three years and a projected future loyalty period of another three years”.
Can you imagine the data needed to make this definition work? 
The exercise at this customer’s site produced 87 different data types coming from the ERP and CRM systems as well as external data like Net Promotor Scores, contact centre chat data, e-mails and response to LinkedIn posts. It sparked new ways of customer interaction procedures: new sales and order processing methods as well as new aftersales initiatives, the organisation would never have come up with if it hadn’t done this exercise.

Define the services


To move from the monolithically based approach to a more micro service oriented architecture, we needed to decompose the monolith into distinctive reusable services and data components. This approach forces a strict quality management for the data in scope as errors or poor quality will reflect on an enterprise scale. On the other hand, this “do it right the first time” principle avoids replication of work and improves the quality of decision making drastically.The schema below needs some explanation. The intake service triggers the validation service which checks the contact and account data with reference data, Chamber of Commerce data and, when finished, triggers the registration service which in its turn triggers the master data update service. MDM contact is now a superclass of this contact and will be used enterprise wide. Four services now ensure reusability for not just the CRM application but for all other use cases in the organisation. And the data quality improves drastically as the “do-it-right-the-first-time” principle is easier to fund for enterprise wide data. 


Data landscape for a CRM and customer MDM application

Decide on the physical architecture


The classical approach using at least two environments is becoming obsolete for organisations that want to stay ahead of the competition. The separation between transaction processing and analytical processing will go out the window in the next few years. Not only because of the costly maintenance of Extract Transform and Load (ETL) processes between the transaction systems and the data warehouse but first and foremost because of the lack of integration with unstructured data that are in Hadoop Distributed File Sets (HDFS) or streaming data that are caught in Resilient Distributed Datasets (RDD)
The organisation needs a significant leap forward and is now examining the Vector in Hadoop solution, a database that combines the classic SQL environment with NoSQL. The reasons are supported by objective facts: a rapidly scalable full ACID SQL database based on HDFS. It supports modify, insert and updates using a patented technology developed at the University of Amsterdam: the Positional Delta Trees (PDT). More on this in their paper which is published here. The short version of PDT: a separation between the write and read store where updates are merged into the write store at run time using the row index for a correct positioning of the modify/insert or update. The result? Online updates without impacting the read performance. Since the database can also access Spark’s parallel processing capability combining Spark RDD architecture accessed from the SQL perspective so that queries that were previously impossible to consider, this system combines the very best of three worlds: ACID based transaction support, complex event processing and HDFS support for unstructured data analytics with a flexible approach to changing data influx –provided you do your homework and define the column families in the broadest possible sense to fit your analytical needs. 
Data loading – if that is the purpose - can be achieved at a rate of around 4TB per hour comprising four billion ‘120 column’ tuples per hour on a 10 node Hadoop cluster – or around  500 billion columns per hour in total! (many caveats apply but it is still a remarkable performance.
The advantage of this architecture will be exploited to the maximum if the data architecture is connecting transaction data, which are by definition microscopic and consistent, to analytical concepts which are macroscopic, flexible and fuzzy. So here is –finally!- my sales pitch: do your proper business analysis for analytics well. Because the cost of preparing for a well thought through system is a fraction of the license-, hardware- and maintenance cost.


Epilogue: an initial approach


A first attempt to map the various data ingestions to Vector H and the consumers of the data was made as illustrated below. This has a few consequences we will discuss in the next few paragraphs.


A more in depth example of Vector H’s power


One aspect will be along the Spark line – the ease of facilitating combined queries that incorporate data that is held in Hadoop with managed structured data in a way that standard BI tools simply query the database in the same way that they do a standard SQL database. I.e. the user does not need to use ETL or ELT separately from the actual BI query for ad-hoc queries once they have defined the external table as referencing the Hadoop data. It is hard to define the simplification this brings.  In its simple form – it’s like the data really is inside the Vector database. This brings the advantage that current solutions – including off the peg turnkey applications can access this data.


This example shows the declaration made by the DBA, once this is done, the end users’ business layer will simply see ‘tweets’ as a table that can be joined to actual tables 

CREATE EXTERNAL TABLE tweets
(username VARCHAR(20),
tweet VARCHAR(100),
timestamp VARCHAR(50))
USING SPARK
WITH REFERENCE='hdfs://blue/tmp/twitter.avro',
FORMAT='com.databricks.spark.avro' 

This command will select tweets that are made which are from customers only, those from non-customers will be ignored:
SELECT tw.username , cust.firstname, cust.lastname, tw.tweet 
FROM tweets  tw,
            Customers cust
WHERE tw.username = cust.username 
AND      tw.Timestamp > TIMESTAMPDIFF( SECONDS, 120, CURRENT_TIMESTAMP )
\g
Similar queries can track non-customer queries.
Where possible restrictions will be pushed down to the Spark ( Map Reduce and Scala level ) in Hadoop to be answered. The data never needs to be stored. Of course some data may be required to be added to the structured data. I already applied this in a customer analysis project where I illustrated how the results from Big Data analytics can be transformed to dimensions in the “classical” data warehouse:


To conclude: will hybrid architectures make data modelling obsolete?


I can’t yet generalise this for all hybrid databases but at least from Vector H we know that there is a serious chance. It uses a partition clause that distributes data on the hash of one or more columns that have a minimum of 10X unique values evenly distributed as the number of partitions you are using.

Vector H is therefore the most model agnostic data store I know. You simply create a schema, load data and run queries. There is no need for indexing or some form of normalisation with this technology.
Whereas the need for 3NF, Data Vault or Star schemas may become less important, governing these massive amounts of data in a less organised way may become the principal issue to focus on. And metadata management may become the elephant in the room.


dinsdag 25 juli 2017

What if Analytics Drove the Information Architecture Development?

Introduction


Information architecture helps people to understand their work field, their relationships with the real world as well as with the information systems which are supposed to reflect the real world.
Information architecture deals with objects, their relationships, hierarchies, categories and how to store them in and retrieve them from applications, files, websites, social media and other sources I forget to mention…
With the massive expansion of sensor data rebaptised “the Internet of Things”, social media and linked open data, these semi structured and unstructured data are adding complexity to the information architecture.
On the other hand, hypercompetitive environments force agility upon the larger corporations as the next garage start-up may overthrow their business model and their dominance in an incredible short time span. This agility is translated in flexible applications with point and click business process reengineering.
So how does all this affect the information architecture development? That is the approach to submit to your judgement in the next paragraphs.

Analytics, the classical chain of events


In many large organisations, the process can be described in eight separate stages:
A business question is formulated, e.g. who are my most loyal customers from the past that may be vulnerable to competitive offers?
The data analyst starts looking for data that can contribute to an answer by breaking the business question into related questions, e.g. which customers have given proof of price sensitivity? Which customers have shown a downward trend in their net promotor score? Which customers are reducing their purchases of consumables, Etc…
Gathering the data is the next step: in transaction systems, market research data, social media, e-mails,…
Manipulating the data: from simple cleaning and conforming operations to very complex pipeline processing of text and web URLs to make the data useful for analysis
But before that, visualisation may already provide intuitive insights: histograms, heat maps, bubble charts and the likes may show you approaches for further analysis
Analysing the data with the possibilities offered to analyse text, the old dichotomy between quantitative and qualitative research has become obsolete. Modern analytics is about hop skip and jump between the two extremes: quantitative approaches will tell you about the proportion of clients that may look for greener pastures whereas qualitative analytics will probe for reasons and root causes.
Interpreting the data may follow more intuitive paths where extra information is added, opinions are collected using the Delphi technique or other qualitative approaches to add useful meaning and actionable insights to the analysis. E.g. developing a customer scoring model that is broadly used and understood in the organisation.
The hardest part is the last phase: integrate the data and the analytics in the decision making process. To conclude with our example: developing scripts and scenarios for the call centre agents that pop up whenever a client with a potential defection risk calls the company.

Architecture development, the classical chain of events


TOGAF's Architecture Dvelopment Method


Togaf’s architecture development method (ADM) also follows a structured path as the illustration shows.  For a detailed information on the Togaf ADM, we refer to the Open Group website: http://www.opengroup.org/subjectareas/enterprise/togaf
At the heart of Enterprise Architecture development is the management of requirements. These requirements are predominantly based on process support.
User stories like “As a call centre agent, I want to see the entire customer history when call comes in in order to serve the customer better” are process support requirements. The data are defined within the context of the process. In this comprehensive case, some level of enterprise class da ta is attained but what about more microscopic user stories like “As a dunning clerk I want to see the accounts receivable per customer sorted per days overdue”. In this case, no context about why the customer is overdue is in scope. Maybe the delivery was late or incorrect, maybe the customer has a complaint filed with customer service or maybe the invoice was sent late and arrived during the client’s holiday closing…

Yes, we have a shifting paradigm!


I know, in this business the paradigm notion is an overrated concept, abused for pouring old wine in new bags. But in Thomas Kuhn’s strict definition of the term, I think we do stand a chance of dealing a with a paradigm shift in information architecture development.
A must read for anyone in information technology

I see critical anomalies:
inconsistent decision making depending on the flavour of the day and the profile of the decision maker, often based on inconsistent information which is extracted from inconsistent data. With a time to market reducing to smaller and smaller timeframes, the old process based architecture development method may prove to be ineffective to meet the challenges of new entrants and substitute products and services. Although every pundit is touting that information is the new oil, not too many companies are using it as the basis of information architecture development.
The old top down view leads to underperforming data retrieval which is no more sustainable in a digital competitive environment where time to market is often equal to the time it takes to tailor data to your needs, e.g. recommenders in e-business, cross selling in retail, risk assessment in insurance,…

There’s external pressure from the GDPR

By now every organisation doing business with or in the EU will be aware of the 25th May 2018, date when the general data protection regulation or GDPR, comes into effect which requires:
valid and explicit consent for the use of any data that can identify a person,
data protection by default (anonymization, pseudonymisation and security measures for data,
data breaches communication to the authorities and
records of processing activities.
Data management activities needed for compiance with the new legislation 

This requires organisations to manage their data on individuals far better and more centralised than they did in the past. Data requirements on persons will be at the heart of the information architecture development cycles as dealing with those on a lower level in the architecture framework will be a sure recipe for disaster.

Technology also contributes to this new approach

At least three technology evolutions enable the data centric approach to information architecture development: microservices, master data management tools and hybrid databases.
Microservices enable rapid scaling and reengineering of processes. The use of consistent data throughout the microservices architecture is a prerequisite.
Master data management tools are maturing as each relevant player is expanding from its original competence into the two others. You can observe data governance tools adding data quality and master data management functionality as well as data quality tools developing master data management and governance services and… you know where this is going.
Last but not least, hybrid databases will enable better storage and retrieval options as they support both transactional and analytical operations on structured and unstructured data.

In conclusion: modern information architecture needs flexible and fluid process management support using consistent data to facilitate consistent decision making, both by humans and machines.

In the next post, I will use a case to illustrate this approach. In the meantime, I look forward to your remarks and inputs for a thorough discussion. 

zaterdag 11 februari 2017

An Analytics Perspective on TOGAF 9

TOGAF is gaining traction all over the globe as a framework for enterprise architecture management. I have been using the framework since 2008 and I must admit in the beginning it was a struggle to tailor TOGAF for business intelligence purposes. Mainly because most organizations use it to manage their application landscape and plan and control application development. In their world, business intelligence (BI) is something that comes after “the real stuff” has been accomplished. Simply because in their view, BI is about collecting data from sources, massage them into a readable schema and publish reports.
After seven years of applying TOGAF in BI architectures for logistics, finance and marketing, it is time to open the debate on adapting TOGAF for analytical purposes. 


With the coming of the Internet of Things and other Big Data tidal waves, enterprise architects are under great pressure to deliver meaningful roadmaps to deal with these phenomena.
I sincerely hope my readers will contribute and improve the quality of the BI deliverables from a TOGAF perspective and vice versa.

TOGAF for analytics, three architecture domains


Business Intelligence is a clearly defined business capability: decision making, based on fact-based analytics to improve overall organizational performance. It interfaces on three levels: the business architecture, the data architecture and the application architecture.  The technology architecture isn’t included as BI is agnostic to network and middleware protocols and processing standards.
Yet, not everybody agrees with this three-layered view. A quick search on the Web delivers a more restricted view: business and data. That’s all.

Hennie de Nooijer’s blog states the following: Where is BI positioned in TOGAF? You need to understand the business perspective (baseline and target) and you need to understand how BI could aid the target business perspective in such a way that it can benefit from BI. And BI is much about data and there the data perspective is also specific area of interest in case of BI.
BIZZdesign, a leading Archimate Enterprise Architecture provider uses DAMA’s DMBOK to connect these concepts with business capabilities. Yet a two dimensional (data-business) view like this  is not taking into account how applications support the data definition, data capturing and data usage in operational environments and isn’t operational BI a discipline in itself?
Bas van Gils, from BIZZdesign states:
Transaction systems directly supporting business processes maintain data at a low level of granularity 
Business Intelligence is a query, analysis, and reporting capability of the organization that provides insight in historical and aggregated data of the organization 
A data warehouse (EDW) is a technical environment that enables Business Intelligence

If this is the premise, then I understand why BIZZdesign reduces BI EA to a business – data aspect. But if you accept that Business Intelligence delivers drill paths to the lowest level of granularity and BI is not just about tactical and strategic decision making then the application view comes in to play. Both source and target applications complete the picture. With “source applications” the transaction systems and external data sources are described as they influence the capabilities of the BI system. I use “target applications” to describe well designed solutions derived from the BI system like fraud detection, churn management, preventive maintenance etc…

To paraphrase a well-known dictum from a Finnish architect “Always design a decision support system by considering it in its next larger context":  the way we make decisions based on data, the way we gather and publish data, the way these data are created and used in transaction systems. And, to close the loop, the way we materialise aspects from our world view by defining our data requirements in operations and decision making.
The business architecture looks at the strategy, governance, organization and the key business processes. In all of these the BI aspect is omnipresent:
strategy: “What do we need to know to form, formulate and execute our strategy with a maximum level of confidence?”
governance: “What is our universe of discourse and what are the key definitions everybody needs to know to communicate effectively?”
organization: “Which functions, levels, key people need to have access to which information?”
key business processes: “What Critical Success Factors (CSF) and their related Key Performance Indicators (KPI) do we define, track and manage?”

The answers to these high level questions can be considered as the key business requirements from a business perspective.
The data architecture of the logical and physical data assets is derived from the business architecture. Conformed dimensions and facts from the ultimate target model and the lineage from source to this ultimate target model as well as the patterns for transforming the source data into the ultimate target model are managed in this domain.
Note that I introduce the term “ultimate target model” as there can be many intermediate target models along the way: from Hadoop file systems with schema on read and/or staging tables via 3NF or data vault or in a virtualized environment to end up in a Star schema which can be linked to a file system and/or a graph data is the present state of the art.

The generic Enterprise BI architecture on application level illustrates how important requirements are met:
In case unstructured data from texts and social media are used in Hadoop files systems, the (structured) results can be integrated in the enterprise data warehouse to provide extra context.
Transaction systems data may pass through a data vault as this guarantees flexibility when source systems change because of changing business processes and the ensuing requirements changes.
The Enterprise Data Warehouse (EDW) is a bottom up process based grouping of Star schemas sharing conformed dimensions. These conformed dimensions make sure everybody in the organisation has a consistent view of the facts.  In case the data vault undergoes changes, the EDW needs to follow as well as the data marts. In case the data mart is process based, it is a physical part of the EDW, in case the data mart is based on business functions, it is built on top of the EDW, grouping and aggregating data from the EDW.

What makes Togaf for Analytics special
A generic architecture from an analytical perspective


The application architecture in TOGAF’s definition deals with the interactions and relationships to core business processes of the organisation. It is easy to start a discussion on what is and what isn’t a core business process as this depends on the type of organisation.  From a BI perspective these are the business processes that are core to any organisation:
collecting information from a business and technology perspective.
The business perspective deals of data collection deals with certain CSF and KPI that influence the reliability of the source data. E.g. a contact centre assistant whose principal KPI is average handling time will find all sorts of shortcuts to log data and will probably omit important information in his after call wrap up process as he gets a bonus when exceeding the expected number of calls per day.
From a technology perspective, the data formats, the transformation rules per source system, the audit trail and archiving prescriptions are managed in this domain. The focus is on governing data quality and data integrity and security to produce reliable information to authorised users.  The objective is aimed at decision making: who decides what and needs which supporting information to make the best possible decision at reasonable cost. This aspect is often lacking in BI architectures leading to a forest of “nice to haves” where the “must haves” get lost.

Managing the Analytics ADM

an architecture development method in TOGAF
TOGAF's architecture development method


The TOGAF Architecture Development Method is a phased approach to move from an “as is” to a “to be” situation. As the illustration above suggests, the business requirements are at the centre and connect to every stage in the process. But there is a snag from a BI perspective.
Most applications have been developed from a process support perspective and less from an information management perspective. Take a high level requirement like “I want to manage my inventory processes better, avoid leakage, depletion and high inventory carrying costs”. This requirement led to an nifty ERP module that has all the functionality to deliver. Later on, BI requirements are formulated to support cross functional decision making areas like “I want to optimise my service level” which includes marketing data and customer satisfaction metrics like Net Promoter Scores with comments in text form.  This may lead to rework in the ERP source system as well as a complete review of how customer satisfaction data are gathered and stored. In other words, analytical requirements are an important –maybe the principal- component in requirements management for the overall architecture development method.


maandag 24 oktober 2016

Comments on a Peer Exchange on Shadow BI

Last October 18, I took part in a peer exchange with about 60 analytics professionals to reflect on three questions:
  • ·        What are the top three reasons for Shadow BI?
  • ·        What are the top three opportunities Shadow BI may bring to the organisation?
  • ·        What are the top three solutions for the issues it brings about?
brainstorm
One of the ten peer exchange products

The group process produced some interesting insights as indicated in the previous post.
Some of these remarks triggered me to elaborate a bit more on them.

Some of them download open source data science tools like Weka and KNIME and take it a step further using fancier regression techniques as well as machine learning and deep learning to come up with new insights.
There we have it: the citizen data scientist. A another big promise, launched by Gartner a couple of years ago. The suggestion that anyone can be a data miner is simply pie in the sky. Would you like to be treated by citizen brain surgeon?  I will not dwell on this too much but let me wrap it up with the term “spurious correlations” and a nice pic that says it all from Tyler Vigen’s website 


the myth of the citizen data scientist
A funny example of what happens when you mix up correlation with causation
Other, frequently mentioned reasons were the lack of business knowledge, changing requirements from the business  and the inadequate funding clearly indicate a troubled relationship between ICT and the business as the root cause for Shadow BI.
I wrote “Business Analysis for Business Intelligence” exactly for this reason. The people with affinity for and knowledge of both the business and the IT issues in BI are a rare breed.  And even if you find that rare species in your organisation, chances are you’re dealing with an IT profile that has done the BI trick a few times for a specific business function and then becomes a business analyst.  And worse, if this person come from application development, chances are high he or she will use what I call the “waiter’s waterfall method” . The term “waiter” meaning he or she will bring you exactly what you asked for. The term “waterfall” to describe the linear development path and by the time the “analytical product” is delivered, the business is already looking at new issues and complaining about obsolete information . Some participants at the peer exchange claimed that agile BI was the silver bullet but I beg to differ. The optimum solution is “infrastructural agility” which means two approaches. First you need complete insight in the data structure of minimally the business function impacted and preferably on an enterprise level. Only then can you challenge the requirements and indicate opportunities for better decision making by adding other data feeds. In a Big Data scenario you can add open data and other external data sources to that landscape. The second is about analysing the decision making processes your counterpart is involved in. The minimum scope is within his or her domain, the optimum analysis is the interactions of his or her domain with the enterprise domains.

Shadow BI can improve efficiency in decision making provided the data quality is fit for purpose. 
This is absolutely true: data quality in the sense of “fit for purpose” is a more agile approach to data quality than the often used “within specs” approach in data quality. Marketing will use a fuzzier definition of what a customer is but a very strict definition of who he is and where he is. Logistics will not even bother what a customer is as long as the package gets delivered on the right spot and someone signs for the goods reception. This means that enterprise master data strategies should manage the common denominator in data definitions and data quality but leave enough room for specific use of subsets with specific business and data quality rules.

This under-the-radar form of BI can also foster innovation as users are unrestrained in discovering new patterns, relationships and generate challenging insights.
Just as in any innovation process, not all shadow BI products may be valuable but the opportunity cost of a rigid, centralized BI infrastructure and process may be an order of magnitude greater than the cost of erroneous decision support material. On one condition:  if the innovation process is supported by A/B testing or iterative roll out of the newly inspired decision making support. I often use the metaphor of the boat and the rocket: if the boat leaks, we can still patch it and use a pump to keep the boat afloat but two rubber O-rings caused the death of the Challenger crew in 1986.
risks in decision making support
"Bet your company" decisions are better not based on shadow BI. 
The group came up with both technical and predominantly organizational and HRM solutions.
This proves for the nth time that Business Intelligence projects and processes are of a mixed nature between technical and psychological factors. It is no coincidence that I use concepts from Tversky and Kahneman and other psychologists who studied decision making in the business analysis process.

In conclusion

Strategy alignment and adopting operational systems and processes for analytical purpose were also mentioned in the peer exchange.  Exactly these two are the root causes of poor decision making support if poorly managed.
In the next post I will dig a bit deeper into these two major aspects. In the mean time, have a look at this sponsored message:

Bert Brijs author
The full story on strategy alignment and tuning organisations for better analytics is within reach


woensdag 19 oktober 2016

Shadow BI: shady or open for business?

Shadow BI is a common phenomenon in any organisation where the business has an Open or Microsoft Office on the PC; i.e. 99.9%  of the users can mash up data in spreadsheets, perform rudimentary descriptive and test statistics and some predictions using linear regression. Some of them download open source data science tools like Weka and KNIME and take it a step further using fancier regression techniques as well as machine learning and deep learning to come up with new insights.
On October 18, BA4All’s Analytic Insight 2016 had a peer exchange with about 60 analytics professionals to reflect on three questions:
  • ·        What are the top three reasons for Shadow BI?
  • ·        What are the top three opportunities Shadow BI may bring to the organisation?
  • ·        What are the top three solutions for the issues it brings about?

The most quoted reasons for Shadow BI


Eww! IT is taking some heavy flak from the business: “ICT lacks innovation culture”, “IT wants to control too much!” and especially the time IT takes to deliver the analytics was high on the list.
Other, frequently mentioned reasons were the lack of business knowledge, changing requirements from the business  and the inadequate funding clearly indicate a troubled relationship between ICT and the business as the root cause for Shadow BI.

Yet, opportunities galore!


Shadow BI can improve efficiency in decision making provided the data quality is fit for purpose.  In case of bad data quality it may provoke some lessons learned for the business as they are the custodians of data quality.
This under-the-radar form of BI can also foster innovation as users are unrestrained in discovering new patterns, relationships and generate challenging insights. and provide faster response to business questions.

Peer exchange on BI
A mix of tech and HR came up in the discussions

The top 3 solutions for issues with Shadow BI


The group came up with both technical and predominantly organizational and HRM solutions. Here are the human factors:
  • ·        market BI to the business and IT people,
  • ·        governance (also a technical remedy if the tools are in place)
  • ·        empowerment of the business
  • ·        adopt a fail fast culture
  • ·        knowledge sharing and documentation
  • ·        strategy alignment
  • ·        integrate analytical culture and competencies in the business
  • ·        engage early in the development process
And these are the technical factors:
  • ·        governance tools
  • ·        Self-service BI and data wrangling tools
  • ·        Sandboxes
  • ·        Optimise applications for analytics

For a discussion on some of the arguments we refer to our next post in a few days